Sweden’s Grocers Now Get a Climate Score for 120,000 Foods Every Week
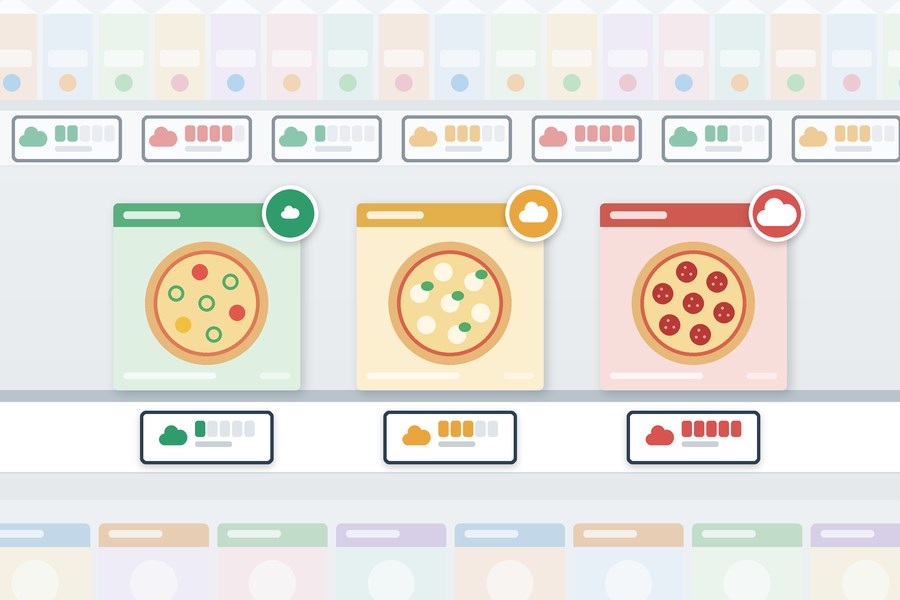
Every week a single data feed now lands at the head offices of Sweden’s three largest grocery groups. It carries a climate footprint for more than 120,000 food products, from frozen pizza to meatballs, and every figure is worked out the same way. Together those three groups hold about 90% of the Swedish grocery market. For retailers everywhere that face pressure to report the emissions hidden in what they sell, it shows something that was out of reach a few years ago: carbon counted product by product across almost a whole national food range, and refreshed as fast as the range itself changes.
What happened
A Stockholm food data company now supplies the weekly figures to the three groups. A retail technology publication and a plant based business magazine both reported this month that all of the footprints follow one methodology agreed by the industry. The groups use the data to report emissions across their value chains, to find the hotspots in their ranges and to decide where cutting emissions would make the biggest difference.
The method itself came first. The Swedish Food Retailers’ Federation and the Swedish Food Federation commissioned a research institute to write a shared calculation method for food, and it was first published in 2023. The data company was chosen in 2025 to apply that method to the whole grocery assortment. A Swedish retail trade publication first reported the weekly deliveries in late September. It quoted the federation’s head of sustainability as saying that for the first time Swedish grocery retail has comparable climate footprints for its entire food range.
Then and now
Until recently a product’s carbon footprint was a bespoke piece of work. A specialist would build a life cycle assessment for one item, which meant tracing its ingredients, processing, transport and packaging, and then applying their own choices about where to draw the boundaries. A 2023 paper from the two Swedish federations set out the problem plainly. There was no single way to do the calculation, and those choices decided the result. A retailer could not fairly compare two suppliers. The paper’s stated goal was simple: a litre of milk should carry the same footprint at one retailer as at another.
Retailers that wanted a view of their whole range usually fell back on category averages. Every cheese pizza was treated as roughly the same cheese pizza. That approach can support a headline emissions figure, but it says nothing about which recipe or which supplier is doing better.
Researchers showed what was being missed. In 2022 a team of university researchers estimated the environmental impact of about 57,000 food and drink products sold in the UK and Ireland, using data gathered from twelve online supermarkets. Because manufacturers rarely publish ingredient quantities, the team inferred them from the percentages and the order of ingredients printed on packs. Within a single type of food the lower impact versions often had between half and a tenth of the impact of the higher impact ones. Averages hide that spread.
How the system works
The Swedish system turns that research approach into a routine industrial process. It starts with product information that suppliers already register in the country’s shared barcode and product data pools. That information is structured and filled in where it is incomplete. Each ingredient is then matched to emission factors from third party life cycle databases, chosen by the raw material, the production method and the country of origin. The boundaries of the different databases have been aligned so that they all follow the common method.
The calculation covers ingredients, processing, transport and consumer packaging. The result is expressed as kilograms of carbon dioxide equivalent per kilogram of product. Because each item is calculated from its own recipe, two pizzas or two packs of meatballs in the same category can end up with different figures. Plant based brands are assessed with the same method as meat and dairy products.
Automation is what makes the scale possible. Ranges change constantly as recipes are reformulated and new lines are listed. The data company’s chief executive has said that applying the method across more than 100,000 changing products requires technology. A weekly refresh keeps the figures in step with the range as it changes.
Where else it is happening
The United Kingdom took a similar route through its retail trade body. In December 2023 a grocery trade publication reported on a coalition led by that body and built around a UK software company’s automated life cycle assessment platform, developed in consultation with environmental and food industry organisations. Four large grocers had chosen to implement the system and three more were piloting it, alongside major food suppliers. The platform can run assessments on thousands of products in hours. Suppliers can refine the figures their retail customers rely on while protecting their own commercial data.
France is pushing the data towards shoppers. Since April 2026 a large French hypermarket group has shown an official environmental cost score on all of its own label food products, more than 6,000 lines, according to a French business publication. The score follows the European product environmental footprint method and covers 16 environmental factors rather than carbon alone, including water, biodiversity and soil. It appears on the group’s online shop, its click and collect service and its mobile app, where shoppers can scan a barcode. A staged rollout to electronic shelf labels in its stores is planned.
Japan is building the method from the government side. In 2024 the farm ministry released a draft guide for calculating the carbon footprint of processed foods across the full life cycle, from sourcing raw materials to disposal and recycling. A Japanese sustainability publication reported that two of the country’s largest retail groups had begun using it to assess products.
Denmark chose a state route. In April 2022 its food ministry announced plans for a state controlled climate label for food and set aside DKK 9 million, about €1.2 million, for the work that year. Because the European Commission would not allow Denmark to require climate labels on all foods, the label was planned as a voluntary scheme.
What retailers gain
The first gain is in reporting. Retailers increasingly have to account for emissions across their value chains, and that includes every product they sell. Product level data built on one shared method gives sustainability teams a figure they can defend and track year by year, instead of one rebuilt from averages each time.
The second gain is in buying. Once every product carries its own number, the gap between two suppliers of the same item becomes visible. That turns climate targets into a practical conversation with a supplier about a recipe, a packaging format or a sourcing country. In Sweden suppliers that share their own production data can make their figures more precise over time.
The third gain is comparability. When every retailer in a market works from the same calculation, a supplier no longer has to answer several versions of the same question in several formats. A product carries one footprint wherever it is sold. That was the federations’ aim when the method was first drafted.
Finally the same data can reach customers when a retailer decides it should. The French example shows a score moving from a reporting system into an app and, in time, onto the shelf edge.
The hard parts
Precision is the main limit. The Swedish figures currently rely mainly on secondary and representative life cycle data rather than measurements from each farm or factory. Two products with similar recipes but very different farming practices can therefore look closer than they really are. The British research team made the same point about its own estimates: packaging rarely says where ingredients come from or how they were grown, and that information would improve accuracy.
Getting better data depends on suppliers. Farm level emissions are hard to gather. The UK coalition set up a dedicated workstream to find a consistent way to bring farm data into supply chain footprints.
Methods still differ between countries. Sweden counts carbon, while the French score weighs 16 environmental factors. A multinational supplier can face different numbers for the same product in different markets.
Shoppers may not change their habits even when the data is in front of them. In 2024 Denmark’s competition and consumer authority tested candidate designs for the national label in randomised experiments. A scale style label helped consumers identify the climate friendly option, yet it did not change overall buying behaviour. For retailers this suggests the biggest effect of product level data may come from range and sourcing decisions rather than from labels alone.
Governance questions remain too. The Swedish federations’ 2023 paper listed issues still to be settled, including who would run and update a shared database, how it would be reviewed and how it would be financed.
From annual report to weekly feed
The next steps are already set out. In Sweden the plan is to add more producer specific data over time, so that estimates built from representative averages are gradually replaced by real supply chain figures. In France the environmental cost score is due to reach electronic shelf labels in stages. In Denmark the consumer authority tested label designs in 2024 to support the national label planned by the food ministry.
For grocers elsewhere the Swedish case moves the question on. Calculating a footprint for every product is no longer the obstacle. It can be automated, refreshed weekly and shared across almost an entire market. The real decisions now concern how far to trust secondary data, how hard to push suppliers for their own numbers and whether to put those numbers in front of shoppers. Those choices, more than the arithmetic, will decide how much product level climate data changes what ends up on the shelf.
Sources
[1] Retail Technology Innovation Hub
[2] vegconomist
[3] Butikstrender
[5] Grocery Gazette
[6] Économie Matin
[7] Zenbird
[8] FoodNavigator

You may also like

Smart Glasses Move Into the Last Few Metres of Parcel Delivery